


Original Article - Year 2023 - Volume 38 -
Quality of life of Brazilian plastic surgeons
Qualidade de vida dos cirurgiões plásticos brasileiros
Guilherme Frederico Ferro Alves1,* ; Saulo Mendes Sobreira2; André Dias Coni2; Catherine Maureira Oyharçabal2; Thiago Sipas Teixeira Luz2; Marcio Yuri de Souza Ferreira2; Ricardo Jean Bertinatto2; Denis Valter Calazans Loma2
ABSTRACT
Introduction: Medical quality of life (QoL) is an international object of study. Brazilian Plastic Surgeons QoL hasn`t yet been assessed, with few studies to perform any evaluation on the subject or estimate variables involved.
Method: This is a transversal, non-comparative, non-experimental, contemporary and of full selection study. An on-line research was performed between July and December in 2021, through the WHOQOL-bref questionnaire application, added with social-demographic information. The population will be composed of plastic surgery residents and surgeons associated with the Brazilian Society of Plastic Surgery (SBCP).
Results: We obtained 168 answers via Google Forms®, which allowed us to determine our population through social- demographic questionnaire and make associations with the WHOQOL-bref findings.
Conclusion: The current study identified correlations between sociodemographics and quality of life of the Brazilian plastic surgeon. We bring forward descriptive data on a subpopulation of responders inside the SBCP, which achieved a score positively higher than 50% in all of the questionnaire domains.
Keywords: Quality of life; Surgery, plastic; Socioeconomic survey; Brazil; World Health Organization
RESUMO
Introdução: A qualidade de vida (QV) dos médicos é objeto de atenção e de estudo internacionalmente. A QV dos cirurgiões plásticos do Brasil ainda não foi avaliada e não existem descrições das nuances e variáveis que estão mais ou menos relacionadas com a QV dos mesmos.
Método: Trata-se de um estudo transversal, de seleção completa, não comparado, não experimental, contemporâneo. Pesquisa foi realizada on-line, entre julho e dezembro de 2021, por meio da aplicação do questionário WHOQOL-bref aos médicos residentes da especialização em cirurgia plástica e médicos cirurgiões plásticos associados à Sociedade Brasileira de Cirurgia Plástica (SBCP). As características sociodemográficas e ocupacionais serão relacionadas à QV.
Resultados: Obtivemos 168 respostas dos formulários preenchidos via Google Forms®, o que possibilitou determinar a população estudada pelo questionário sociodemográfico e realizar as associações com os achados do WHOQOL-bref.
Conclusão: O presente estudo identificou associação de fatores sociodemográficos à qualidade de vida do cirurgião plástico brasileiro. Delimitamos uma população específica dentro dos participantes da SBCP, a qual pontuou acima de 50% positivamente em todos os domínios do questionário.
Palavras-chave: Qualidade de vida; Cirurgia plástica; Enquete socioeconômica; Brasil; Organização Mundial da Saúde
INTRODUCTION
Throughout history, the quality of life (QoL) concept has undergone significant changes and can still be seen from different perspectives today. According to the definition recommended by the World Health Organization (WHO), QoL is an individual’s perception of their satisfied needs and achieved opportunities for happiness and self-fulfillment, depending on their physical health status or social and economic conditions1.
Within the professional context of the medical class, QoL has gained significant notoriety in recent years due to the wide evidence of high rates of suicide, anxiety, and burnout. In response to such data, numerous changes in perspectives and working conditions were promoted, such as restriction of working hours and mechanisms of action in case of workers in physical and/or emotional exhaustion2.
Specifically, studies indicate that the surgical specialty still has QoL rates similar to or lower than the results of physicians in the clinical area. Sanchez suggests under study that these variations can be due to the technical challenges imposed by the lack of hospital resources, unpredictable working hours, and high expectations regarding surgical results. Such factors have a positive correlation with the development of anxiety, depression, and burnout syndrome, culminating in a feeling of emotional exhaustion, depersonalization, and lack of personal fulfillment3,4.
In part, the negative QoL relationships presented by the surgeons are rooted in the development and perpetuation of certain habits initiated during the trainee surgeon’s training period. Studies indicate that inconsistencies in sleep, food intake, and time available to carry out personal projects - such as physical activity and social gatherings - are factors commonly presented by residents and are even reported as reasons for dropping out of specialization4,5.
Concerning plastic surgeons, the QoL rates are similar to those of surgeons in general. This fact is associated with the persistence of the scored factors, added perspectives with the patient’s intimate suffering, and a feeling of greater personal responsibility for the surgical results6.
Independently, the same studies point out that the surgeon’s QoL can be positively influenced by several factors of personal life and job satisfaction - these include marriage and raising children, monthly income above 30 thousand reais, working time for more than 10 years and performing more than four surgeries per week. It is noted that such variables are normally related to the advancement of time and stabilization of the professional career, which places the surgeon in training in the risk group for the development of Burnout syndrome, mental disorders, and lower QoL scores3,6,7.
When the global spread of the SARS-CoV-2 virus was contextualized in the current scenario, declared a pandemic by the WHO in March 2020, anxiety rates and QoL indices suffered significant environmental interference. In addition to the possibility of illness, some of the actions imposed to control contagion and combat the new agent ended up interfering with the daily life and work of plastic surgeons. These include but are not limited to postponing non-essential elective surgeries and restricting office visits essential for the surgeon’s work8,9.
At the same time, health professionals are found to be directly affected by the psychosocial effects of the COVID-19 pandemic. In this regard, the daily difficulties of medical specialties are intensified by shortages in the hospital environment, financial crises, and social isolation. Such factors were previously described as predisposing to the increased incidence of alcohol abuse and psychoactive substances as a form of momentary relief from stress and service overload10,11.
In this context, the proposed study is justified by the literary scarcity of data on the quality of life of Brazilian plastic surgeons, combined with the historical moment in which we live. We intend to evaluate the nuances in quality of life while consolidating a professional career and facing the current scenario.
OBJECTIVE
To evaluate the plastic surgeon’s quality of life through the application of the WHOQOL-Bref questionnaire. Establish the quality of life profile of research participants. Relate the research findings with the factors considered: socioeconomic and demographic factors.
METHOD
This is a cross-sectional, complete selection, non-comparative, non-experimental, contemporary study. A sample calculation was performed considering the total population of plastic surgeons (n=7079) with the need for 365 respondents for a 95% confidence interval.
The study will be conducted in a virtual environment via Google Forms®, sent to the electronic address of the participants with authorization and through the SBCP mailing, preserving the confidentiality of the data.
In the statistical analysis, parametric and non-parametric tests will be used according to the guidelines in the manual, with results considered significant when p<0,05.
RESULTS
After statistical evaluation of the completed forms via Google Forms®, with a questionnaire containing a socio-demographic section and another with Whoqol-Bref questions. We obtained 168 responses, summarized below.
Socio-demographic Aspects
One hundred sixty-eight plastic surgeons participated in this project, of which 127 (75.59%) were men, 41 (24.4%) were women; 45% of participants were over 50 years old, 31.5% were between 40 and 49 years old, and 23% between 30 and 39 years old; with a predominance of white ethnicity 87.9%, followed by brown 8.5%, yellow 2.4%, undeclared 0.6%, and black 0.6%.
As for marital status, married people were predominant (68.5%), followed by a stable union (12.1%), divorced (10.3%), single (7.9%), and widowed (1.2%).
Regarding the number of children, there was a higher proportion of at least 2 children (43.6%). No children comprised 26.7% of the sample, 1 child 21.2%, 3 children 7.3%, and more than 3 children 2.2%.
The geographical distribution was mainly in the Southeast at 56.4%, South at 19.4%, Northeast at 13.9%, Midwest at 6.1%, and North at 4.2%.
The professionals in question are 51.2% full members of the Sociedade Brasileira de Cirurgia Plástica and 48.2% associate members of the Sociedade Brasileira de Cirurgia Plástica.
Regarding the level of education, we found that 67.9% are specialists, 14.5% masters, 6.1% doctors, 3.6% doctorate, 3.6% associate professors, 3% master’s students, 0.6% postgraduate doctors, and 0.6% postdoctoral.
Of these professionals, 46.7% have been working in plastic surgery for over 20 years, 24.2% have been working between 11 and 20 years, 15.8% have been working for less than 5 years, and 13.3% have been working between 6 and 10 years.
When evaluating the weekly working hours, 24.9% were between 41 and 50 hours a week, 23% between 31 and 40 hours a week, 31.8% between 51 and 60 hours a week, 18.2% more than 60 hours a week weekly and 12.1% less than 30 hours per week.
Regarding average monthly income: 34.5% earn >50 thousand reais, 21.2% between 31 and 40 thousand reais, 18.8% between 20 and 30 thousand, 17% <20 thousand, and 8.5% between 41 and 50 thousand reais.
When asked about areas of expertise, 72.1% work with aesthetic plastic surgery, 24.9% with reconstructive plastic surgery, and 3% with general surgery.
The respondents’ employment relationship includes: 38.2% self-employed, 21.2% self-employed and linked to the public health system, 18.2% are self-employed and linked to health insurance plans, 10.3% work only at public universities, 7.3% are self-employed, linked to public service and health insurance and 4.8% work only in private universities.
Regarding the number of weekly surgeries these professionals perform, 38.3% perform between 3 and 5 procedures, 38.8% perform less than 3 procedures, 16.4% perform between 5 and 10 procedures, and 6.1% perform more than 10 procedures.
When asked whether they use medical marketing advice, 65.5% answered no, and 34.5% answered yes. When asked about the importance of advice, 29.7% answered medium, 20% answered a lot, 18.8% answered very little, 17% answered little, and 14.5% answered essential.
The professionals were asked if they acted or act in the care of COVID-19, and 79.4% answered no and 20.6% yes. 57.6% answered they did not contract COVID-19, and 42.4% answered yes.
When asked about physical exhaustion during the SARS-COV-2 pandemic, 37% answered medium, 25.4% little, 20% very little, 15.2% a lot, and 2.4% completely. As for mental exhaustion during the SARS-COV-2 pandemic, 29.7% answered a lot, 29.1% medium, 21.8% little, 14.5% very little, and 4.8% completely.
Regarding changes in interpersonal relationships during the SARS-COV-2 pandemic, 42.4% answered a lot, 26.1% a little, 17.6% a little, 9.1% completely, and 4.8% very little.
As for negative changes in the relationship with work during the SARS-COV-2 pandemic, 46.1% answered a lot, 32.1% answered medium, 15.2% little, 3.6% very little, and 3% completely.
As for negative changes in surgical output during the SARS-COV-2 pandemic: 48.5% responded very much, 23% medium, 12.7% completely, 11.5% little, and 4.2% very little. Since 78.5% had a reduction in the number of surgical procedures, outpatient visits, and consultations, and 21.5% had an increase in the number of surgical procedures, outpatient visits, and consultations.
When asked about the need to seek new sources of income during the SARS-COV-2 pandemic, 27.3% answered a lot, 25.4% medium, 23% little, 15.8% a lot, and 8.5% extremely.
When asked about starting or increasing the consumption of psychoactive substances during the SARS-COV-2 pandemic, 76.4% answered no, and 23.6% answered yes. Of these, the most reported substances were alcohol (32%), anxiolytics (48.14%), and antidepressants (7.1%).
Quality of life assessment - WHOQOL-Bref
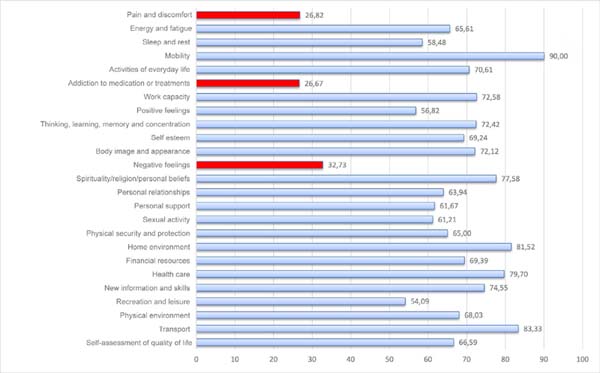
When scaling the WHOQOL-Bref questionnaire responses to a percentage basis, 23 of the 26 variables obtained favorable scores above 50%, the highest being sleep quality (90%), transportation (83.33%), and home environment (81.52%).
Exceptions were made in facets of pain and discomfort (26.82%), dependence on medication or treatments (26.67%), and negative feelings (32.73%). As variables of a negative nature in assessing the quality of life, they should be evaluated in an inverted way, thus becoming favorable responses to the general quality of life. The other responses are illustrated in Figure 1.
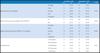
Tables with values obtained for each question, including standard deviation, coefficient of variation and minimum, maximum and range values are available in the annexes. Table 1 summarizes the values obtained for each question and Table 2 summarizes the data by domain within the WHOQOL facets.
| Question | Average | Standard deviation | Coefficient of variation | Minimum value | Maximum value | Amplitude |
|---|---|---|---|---|---|---|
| Q1 | 3.84 | 0.91 | 23.79 | 1 | 5 | 4 |
| Q2 | 3.49 | 0.99 | 28.40 | 1 | 5 | 4 |
| Q3 | 2.07 | 0.90 | 43.47 | 1 | 4 | 3 |
| Q4 | 2.07 | 0.98 | 47.23 | 1 | 5 | 4 |
| Q5 | 3.27 | 0.87 | 26.43 | 1 | 5 | 4 |
| Q6 | 4.10 | 0.81 | 19.71 | 1 | 5 | 4 |
| Q7 | 3.90 | 0.71 | 18.28 | 2 | 5 | 3 |
| Q8 | 3.60 | 0.90 | 24.88 | 1 | 5 | 4 |
| Q9 | 3.72 | 0.85 | 22.71 | 1 | 5 | 4 |
| Q10 | 3.62 | 0.81 | 22.26 | 1 | 5 | 4 |
| Q11 | 3.88 | 0.88 | 22.64 | 1 | 5 | 4 |
| Q12 | 3.78 | 1.00 | 26.54 | 1 | 5 | 4 |
| Q13 | 3.98 | 0.80 | 20.09 | 1 | 5 | 4 |
| Q14 | 3.16 | 0.91 | 28.85 | 1 | 5 | 4 |
| Q15 | 4.60 | 0.74 | 16.07 | 1 | 5 | 4 |
| Q16 | 3.34 | 1.09 | 32.65 | 1 | 5 | 4 |
| Q17 | 3.82 | 0.87 | 22.73 | 2 | 5 | 3 |
| Q18 | 3.90 | 0.84 | 21.59 | 1 | 5 | 4 |
| Q19 | 3.77 | 0.84 | 22.24 | 1 | 5 | 4 |
| Q20 | 3.56 | 0.98 | 27.48 | 1 | 5 | 4 |
| Q21 | 3.45 | 1.08 | 31.44 | 1 | 5 | 4 |
| Q22 | 3.47 | 0.95 | 27.32 | 1 | 5 | 4 |
| Q23 | 4.26 | 0.82 | 19.20 | 2 | 5 | 3 |
| Q24 | 4.19 | 0.84 | 20.01 | 1 | 5 | 4 |
| Q25 | 4.33 | 0.73 | 16.78 | 1 | 5 | 4 |
| Q26 | 2.31 | 0.85 | 36.93 | 1 | 5 | 4 |
| Domain | Average | Standard deviation | Coefficient of variation | Minimum value | Maximum value | Amplitude |
|---|---|---|---|---|---|---|
| Physicist | 15.52 | 1.53 | 9.86 | 9.14 | 17.71 | 8.57 |
| Psychological | 15.08 | 2.14 | 14.17 | 7.33 | 18.00 | 10.67 |
| Social relationships | 13.96 | 3.94 | 28.21 | 4.00 | 20.00 | 16.00 |
| Environment | 15.51 | 3.21 | 20.67 | 4.50 | 20.00 | 15.50 |
| Self-assessment of quality of life | 14.65 | 3.67 | 25.05 | 4.00 | 20.00 | 16.00 |
| Total | 15.17 | 2.55 | 16.83 | 6.31 | 18.62 | 12.31 |
Comparative analysis
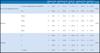
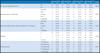
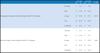
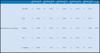
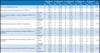
Comparative analysis was performed using the Chisquare test for independence, associating covariates from the sociodemographic test and the WHOQOL-bref. Below, associations of statistical significance are summarized. Tables with all associations can be found in Tables 3 4 5 6 7 8 9.
| Feminine N=40 | Masculine N=125 | P-value | ||||
|---|---|---|---|---|---|---|
| No | % | No | % | |||
| Importance given to marketing | Very little | 8 | (20.0) | 23 | (18.4) | 0.034 |
| Little | 6 | (15.0) | 22 | (17.6) | ||
| Average | 16 | (40.0) | 33 | (26.4) | ||
| Very | 10 | (25.0) | 23 | (18.4) | ||
| Completely | 0 | (0.0) | 24 | (19.2) | ||
| Direct action in the care of patients with COVID-19 | No | 27 | (67.5) | 104 | (83.2) | 0.056 |
| Yes | 13 | (32.5) | 21 | (16.8) | ||
| Mental exhaustion during the SARS-CoV-2 pandemic | Very little | 1 | (2.5) | 23 | (18.4) | 0.004 |
| Little | 5 | (12.5) | 31 | (24.8) | ||
| Average | 14 | (35.0) | 34 | (27.2) | ||
| Very | 15 | (37.5) | 34 | (27.2) | ||
| Completely | 5 | (12.5) | 3 | (2.4) | ||
| Average income | <20 thousand | 13 | (32.5) | 15 | (12.0) | 0.011 |
| 20-30 thousand | 8 | (20.0) | 23 | (18.4) | ||
| 31-40 thousand | 10 | (25.0) | 25 | (20.0) | ||
| 41-50 thousand | 2 | (5.0) | 12 | (9.6) | ||
| >50 thousand | 7 | (17.5) | 50 | (40.0) | ||
| Midwest N=10 | North East N=23 | North N=7 | Southeast N=93 | South N=32 | P-value | |||||||
|---|---|---|---|---|---|---|---|---|---|---|---|---|
| No | % | No | % | No | % | No | % | No | % | |||
| Do you use marketing advisory? | No style="background-color:#D3E2F4" | 5 | (50.0) | 12 | (52.2) | 4 | (57.1) | 71 | (76.3) | 16 | (50.0) | 0.023 |
| Yes | 5 | (50.0) | 11 | (48.8) | 3 | (43.9) | 22 | (34.7) | 16 | (50.0) | ||
| Ethnicity | Yellow | 0 | (0.0) | 0 | (0.0) | 0 | (0.0) | 3 | (3.2) | 1 | (3.1) | 0.038 |
| White | 10 | (100) | 17 | (73.9) | 4 | (57.1) | 83 | (89.2) | 31 | (96.9) | ||
| Brown | 0 | (0.0) | 6 | (26.1) | 3 | (42.9) | 5 | (5.4) | 0 | (0.0) | ||
| Black | 0 | (0.0) | 0 | (0.0) | 0 | (0.0) | 2 | (2,2) | 0 | (0.0) | ||
| Children | 0 | 4 | (40.0) | 3 | (13.0) | 2 | (28.6) | 28 | (30.1) | 7 | (21.9) | 0.036 |
| 1 | 3 | (30.0) | 3 | (13.0) | 1 | (14.3) | 16 | (17.2) | 12 | (37.5) | ||
| 2 | 2 | (20.0) | 13 | (56.5) | 2 | (28.6) | 43 | (46.2) | 12 | (37.5) | ||
| 3 or more | 1 | (10.0) | 4 | (17.5) | 2 | (28.6) | 5 | (6.5) | 1 | (3.1) | ||
| Without children N=44 | 1 child N=35 | 2 children N=72 | 3 or more N=14 | P-value | ||||||
|---|---|---|---|---|---|---|---|---|---|---|
| No | % | No | % | No | % | No | % | |||
| Mental exhaustion during the SARS-CoV-2 pandemic | Very little | 6 | (13.6) | 2 | (5.7) | 14 | (19.4) | 2 | (14.3) | 0.026 |
| Little | 7 | (15.9) | 11 | (31.4) | 17 | (23.6) | 1 | (7.1) | ||
| Average | 16 | (36.4) | 10 | (28.6) | 14 | (19.4) | 8 | (57.2) | ||
| Very | 15 | (34.1) | 7 | (20.0) | 25 | (34.7) | 2 | (14.3) | ||
| Completely | 0 | (0.0) | 5 | (14.3) | 2 | (2.8) | 1 | (7.1) | ||
| Marital status | Married | 17 | (38.6) | 26 | (74.3) | 58 | (80.6) | 12 | (85.7) | <0.001 |
| Divorced | 4 | (9.1) | 3 | (8.6) | 8 | (11.1) | 2 | (14.3) | ||
| Single | 12 | (27.3) | 1 | (2.9) | 0 | (0.0) | 0 | (0.0) | ||
| Stable union | 11 | (25.0) | 4 | (11.4) | 5 | (6.9) | 0 | (0.0) | ||
| Widower | 0 | (0.0) | 1 | (2.9) | 1 | (1.4) | 0 | (0.0) | ||
| Region of residence | Midwest | 4 | (9.1) | 3 | (8.6) | 2 | (2.8) | 1 | (7.1) | 0.036 |
| North East | 3 | (6.8) | 3 | (8.6) | 13 | (18.1) | 4 | (28.6) | ||
| North | 2 | (4.5) | 1 | (2.9) | 2 | (2.8) | 2 | (14.3) | ||
| Southeast | 28 | (63.6) | 16 | (45.7) | 43 | (59.7) | 6 | (42.9) | ||
| South | 7 | (15.9) | 12 | (34.3) | 12 | (16.7) | 1 | (7.1) | ||
| Time since graduation | <5 years | 19 | (43.2) | 3 | (8.6) | 2 | (2.8) | 2 | (14.3) | <0.001 |
| 11-20 years | 6 | (13.6) | 7 | (20.0) | 24 | (33.3) | 3 | (21.4) | ||
| 6-10 years | 7 | (15.9) | 7 | (20.0) | 7 | (9.7) | 1 | (7.1) | ||
| >20 years | 12 | (43.2) | 18 | (51.4) | 39 | (54.2) | 8 | (57.2) | ||
| Average income | <20 thousand | 15 | (34.1) | 5 | (14.3) | 8 | (11.1) | 0 | (0.0) | 0.006 |
| 20-30 thousand | 7 | (15.9) | 10 | (28.6) | 10 | (13.9) | 4 | (28.6) | ||
| 31-40 thousand | 7 | (15.9) | 7 | (20.0) | 20 | (27.8) | 1 | (7.1) | ||
| 41-50 thousand | 2 | (4.5) | 4 | (11.4) | 5 | (6.9) | 3 | (21.4) | ||
| >50 thousand | 13 | (29.5) | 9 | (25.7) | 29 | (40.3) | 6 | (42.9) | ||
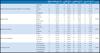
| <5 years N=26 | 6-10 years N=22 | 11-20 years N=40 | >20 years N=77 | P-value | ||||||
|---|---|---|---|---|---|---|---|---|---|---|
| No | % | No | % | No | % | No | % | |||
| Do you use marketing advisory? | No | 11 | (42.3) | 13 | (59.1) | 21 | (52.5) | 63 | (81.8) | <0.001 |
| Yes | 15 | (57.7) | 9 | (40.9) | 19 | (47.5) | 14 | (18.2) | ||
| Importance given to Marketing | Very little | 2 | (7.7) | 3 | (13.6) | 7 | (17.5) | 19 | (24.7) | 0.004 |
| Little | 1 | (3.8) | 1 | (4.5) | 5 | (12.5) | 21 | (27.3) | ||
| Average | 9 | (34.6) | 6 | (27.3) | 10 | (25.0) | 24 | (31.2) | ||
| Very | 7 | (26.9) | 6 | (27.3) | 11 | (27.5) | 9 | (11.7) | ||
| Completely | 7 | (26.9) | 6 | (27.3) | 7 | (17.5) | 4 | (5.2) | ||
| Decreased surgical volume during the SARS-CoV-2 pandemic | Very little | 3 | (11.5) | 1 | (4.5) | 2 | (5.0) | 1 | (11.5) | 0.028 |
| Little | 7 | (26.9) | 3 | (13.6) | 4 | (10.0) | 5 | (26.9) | ||
| Average | 8 | (30.8) | 3 | (13.6) | 9 | (22.5) | 18 | (30.8) | ||
| Very | 5 | (19.2) | 10 | (45.5) | 19 | (47.5) | 46 | (19.2) | ||
| Completely | 3 | (11.5) | 5 | (22.7) | 6 | (15.0) | 7 | (11.5) | ||
| Children | 0 | 19 | (73.0) | 7 | (31.8) | 6 | (15.0) | 12 | (15.6) | <0.001 |
| 1 | 3 | (11.6) | 7 | (31.8) | 7 | (17.5) | 18 | (23.4) | ||
| 2 | 2 | (7.7) | 7 | (31.8) | 24 | (60.0) | 39 | (50.6) | ||
| 3 or more | 2 | (7.7) | 1 | (4.6) | 3 | (7.5) | 8 | (10.4) | ||
| Average income | <20 thousand | 8 | (30.8) | 12 | (15.6) | 4 | (10.0) | 7 | (31.8) | 0.076 |
| 20-30 thousand | 4 | (15.4) | 17 | (22.0) | 6 | (15.0) | 4 | (18.1) | ||
| 31-40 thousand | 1 | (3.8) | 16 | (20.8) | 12 | (30.0) | 6 | (27.3) | ||
| 41-50 thousand | 0 | (0.0) | 6 | (7.8) | 7 | (17.5) | 1 | (4.5) | ||
| >50 thousand | 13 | (50.0) | 26 | (33.8) | 11 | (27.5) | 4 | (18.1) | ||
| No N=95 | Yes N=70 | P-value | ||||
|---|---|---|---|---|---|---|
| No | % | No | % | |||
| Changing the relationship with work during the SARS-CoV-2 pandemic | Very little | 1 | (1,1) | 5 | (7.1) | 0.018 |
| Little | 15 | (15.8) | 10 | (14.3) | ||
| Average | 34 | (35.8) | 19 | (27.1) | ||
| Very | 45 | (47.4) | 31 | (44.3) | ||
| Completely | 0 | (0.0) | 5 | (7.1) | ||
| Decreased surgical volume during the SARS-CoV-2 pandemic | Very little | 2 | (2.1) | 5 | (7.1) | 0.006 |
| Little | 15 | (15.8) | 4 | (5.7) | ||
| Average | 21 | (22.1) | 17 | (24.3) | ||
| Very | 51 | (53.7) | 29 | (41.4) | ||
| Completely | 6 | (6.3) | 15 | (21.4) | ||
| <30 hours N=20 | 31-40 hours N=38 | 41-50 hours N=41 | 51-60 hours N=36 | >60 hours N=30 | P-value | |||||||
|---|---|---|---|---|---|---|---|---|---|---|---|---|
| No | % | No | % | No | % | No | % | No | % | |||
| Importance given to marketing | Very little | 5 | (25.0) | 10 | (26.3) | 6 | (14.6) | 6 | (16.7) | 4 | (13.3) | 0.047 |
| Little | 3 | (15.0) | 3 | (7.9) | 9 | (22.0) | 8 | (22.2) | 5 | (16.7) | ||
| Average | 6 | (30.0) | 15 | (39.5) | 11 | (26.8) | 8 | (22.2) | 9 | (30.0) | ||
| Very | 2 | (10.0) | 8 | (21.1) | 9 | (22.0) | 12 | (33.3) | 2 | (6.7) | ||
| Completely | 4 | (20.0) | 2 | (5.3) | 6 | (14.6) | 2 | (5.6) | 10 | (33.3) | ||
| < 20 thousand N=28 | 20-30 thousand N=31 | 31-40 thousand N=35 | 41-50 thousand N=14 | > 50 thousand N=57 | P-value | |||||||
|---|---|---|---|---|---|---|---|---|---|---|---|---|
| No | % | No | % | No | % | No | % | No | % | |||
| Do you use Marketing Advice? | No | 25 | (89.3) | 23 | (74.2) | 24 | (68.6) | 8 | (57.1) | 28 | (49.1) | 0.004 |
| Yes | 3 | (10.7) | 8 | (25.8) | 11 | (31.4) | 6 | (42.9) | 29 | (50.9) | ||
| Direct action in the care of patients with COVID-19 | No | 17 | (60.7) | 24 | (77.4) | 30 | (85.7) | 9 | (64.3) | 51 | (89.5) | 0.015 |
| Yes | 11 | (39.3) | 7 | (22.6) | 5 | (14.3) | 5 | (35.7) | 6 | (10.5) | ||
| Have you noticed changes in response during the SARS-CoV-2 pandemic? | Very little | 3 | (10.7) | 8 | (25.8) | 3 | (8.6) | 5 | (35.7) | 14 | (24.6) | 0.015 |
| Little | 2 | (7.1) | 2 | (6.5) | 3 | (8.6) | 4 | (28.6) | 11 | (19.3) | ||
| Average | 13 | (46.4) | 14 | (45.2) | 8 | (22.9) | 3 | (21.4) | 18 | (31.6) | ||
| Very | 9 | (32.1) | 5 | (16.1) | 18 | (51.4) | 1 | (7.1) | 12 | (21.1) | ||
| Completely | 1 | (3.6) | 2 | (6.5) | 3 | (8.6) | 1 | (7.1) | 2 | (3.5) | ||
| Mental exhaustion during the SARS-CoV-2 pandemic | Very little | 2 | (7.1) | 2 | (6.5) | 1 | (2.9) | 3 | (21.4) | 16 | (28.1) | 0.047 |
| Little | 4 | (14.3) | 9 | (29.0) | 9 | (25.7) | 5 | (35.7) | 9 | (15.8) | ||
| Average | 9 | (32.1) | 12 | (38.7) | 10 | (28.6) | 3 | (21.4) | 14 | (24.6) | ||
| Very | 10 | (35.7) | 6 | (19.4) | 14 | (40.0) | 2 | (14.3) | 17 | (29.8) | ||
| Completely | 3 | (10.7) | 2 | (6.5) | 1 | (2.9) | 1 | (7.1) | 1 | (1.8) | ||
| Changing interpersonal relationships during the SARS-CoV-2 pandemic | Very little | 1 | (3.6) | 0 | (0.0) | 3 | (8.6) | 1 | (7.1) | 3 | (5.3) | 0.016 |
| Little | 1 | (3.6) | 9 | (29.0) | 2 | (5.7) | 5 | (35.7) | 12 | (21.1) | ||
| Average | 11 | (39.3) | 2 | (6.5) | 8 | (22.9) | 2 | (14.3) | 20 | (35.1) | ||
| Very | 11 | (39.3) | 15 | (48.4) | 20 | (57.1) | 5 | (35.7) | 19 | (33.3) | ||
| Completely | 4 | (14.3) | 5 | 16.1) | 2 | (5.7) | 1 | (7.1) | 3 | (5.3) | ||
| Changing the relationship with work during the SARS-CoV-2 pandemic | Very little | 0 | (0.0) | 0 | (0.0) | 0 | (0.0) | 1 | (7.1) | 5 | (8.8) | 0.056 |
| Little | 2 | (7.1) | 5 | (16.1) | 3 | (8.6) | 3 | (21.4) | 12 | (21.1) | ||
| Average | 5 | (17.9) | 15 | (48.4) | 13 | (37.1) | 4 | (28.6) | 16 | (28.1) | ||
| Very | 19 | (67.9) | 10 | (32.3) | 17 | (48.6) | 6 | (42.9) | 24 | (42.1) | ||
| Completely | 2 | (7.1) | 1 | (3.2) | 2 | (5.7) | 0 | (0.0) | 0 | (0.0) | ||
| Decreased surgical volume during the SARS-CoV-2 pandemic | Very little | 0 | (0.0) | 0 | (0.0) | 1 | (2.9) | 1 | (7.1) | 5 | (8.8) | 0.007 |
| Little | 2 | (7.1) | 4 | (12.9) | 2 | (5.7) | 0 | (0.0) | 11 | (19.3) | ||
| Average | 3 | (10.7) | 6 | (19.4) | 8 | (22.9) | 4 | (28.6) | 17 | (29.8) | ||
| Very | 13 | (46.4) | 17 | (54.8) | 20 | (57.1) | 8 | (57.1) | 22 | (38.6) | ||
| Completely | 10 | (35.7) | 4 | (12.9) | 4 | (11.4) | 1 | (7.1) | 2 | (3.5) | ||
| Would you like to answer how/which activities were changed? | No | 4 | (14.8) | 4 | (14.3) | 6 | (17.1) | 7 | (50.0) | 14 | (24.6) | 0.062 |
| Yes | 23 | (85.2) | 24 | (85.7) | 29 | (82.9) | 7 | (50.0) | 43 | (75.4) | ||
| Did you need new forms of income during the SARS-CoV-2 pandemic? | Very little | 1 | (3.6) | 5 | (16.1) | 8 | (22.9) | 4 | (28.6) | 27 | (47.4) | <0.001 |
| Little | 3 | (10.7) | 11 | (35.5) | 11 | (31.4) | 3 | (21.4) | 10 | (17.5) | ||
| Average | 7 | (25.0) | 7 | (22.6) | 10 | (28.6) | 5 | (35.7) | 13 | (22.8) | ||
| Very | 8 | (28.6) | 4 | (12.9) | 6 | (17.1) | 2 | (14.3) | 6 | (10.5) | ||
| Completely | 9 | (32.1) | 4 | (12.9) | 0 | (0.0) | 0 | (0.0) | 1 | (1.8) | ||
| Increased consumption of psychoactive substances during the SARS-CoV-2 pandemic? | No | 20 | (71.4) | 19 | (61.3) | 29 | (82.9) | 14 | (100.0) | 44 | (77.2) | 0.051 |
| Yes | 8 | (28.6) | 12 | (38.7) | 6 | (17.1) | 0 | (0.0) | 13 | (22.8) | ||
| Children | No children | 15 | (53.6) | 7 | (22.6) | 7 | (20.0) | 3 | (21.4) | 13 | (22.8) | 0.006 |
| 1 | 5 | (17.9) | 10 | (32.3) | 7 | (20.0) | 4 | (28.6) | 9 | (15.8) | ||
| 2 | 8 | (28.6) | 10 | (32.3) | 20 | (57.1) | 5 | (35.7) | 29 | (50.9) | ||
| 3 | 0 | (0.0) | 2 | (6.5) | 1 | (2.9) | 0 | (0.0) | 6 | (10.5) | ||
| >3 | 0 | (0.0) | 2 | (6.5) | 0 | (0.0) | 0 | (0.0) | 0 | (0.0) | ||
| Sex | Feminine | 13 | (46.4) | 8 | (25.8) | 10 | (28.6) | 2 | (14.3) | 13 | (22.8) | 0.011 |
| Masculine | 15 | (53.6) | 23 | (74.2) | 25 | (71.4) | 12 | (85.7) | 7 | (12.3) | ||
| Time since graduation | >20 years | 12 | (42.9) | 17 | (54.8) | 16 | (45.7) | 6 | (42.9) | 26 | (45.6) | 0.076 |
| 11-20 years | 4 | (14.3) | 6 | (19.4) | 12 | (34.3) | 7 | (50.0) | 11 | (19.3) | ||
| 6-10 years | 4 | (14.3) | 4 | (12.9) | 6 | (17.1) | 1 | (7.1) | 7 | (12.3) | ||
| <5 years | 8 | (28.6) | 4 | (12.9) | 1 | (2.9) | 0 | (0.0) | 13 | (22.8) | ||
| Workday | <30h | 6 | (21.4) | 5 | (16.1) | 2 | (5.7) | 1 | (7.1) | 6 | (10.5) | 0.075 |
| 31-40h | 10 | (35.7) | 9 | (29.0) | 9 | (25.7) | 3 | (21.4) | 7 | (12.3) | ||
| 41-50h | 8 | (28.6) | 4 | (12.9) | 13 | (37.1) | 4 | (28.6) | 12 | (21.1) | ||
| 51-60h | 1 | (3.6) | 7 | (22.6) | 8 | (22.9) | 3 | (21.4) | 17 | (29.8) | ||
| >60h | 3 | (10.7) | 6 | (19.4) | 3 | (8.6) | 3 | (2161.4) | 15 | (26.3) | ||
Gender Covariable
When filtering the answers by the gender of the respondent, we have that men give greater importance to medical marketing, with 18.4% and 19.2% considering a lot and complete importance vs. 25% in the female group (p=0.034). Concerning the performance in the care of patients with Sars-Cov-2, 32.5% of women reported care vs. 16.8% of men (p=0.056).
At the same time, women reported greater overall mental exhaustion during the Sars-Cov-2 pandemic, with 37.5% and 12.5% reporting exhaustion of great and complete intensity vs. 27.5% and 2.4% in the male group, respectively. Men also reported 18.4% of very low-intensity exhaustion vs. 2.5% of women (p=0.004).
Finally, when associating gender and income, we found that the female respondents had lower reported monthly income: 32.5% reported income <20 thousand reais/month and 17.5% income >50 thousand reais/month. Comparatively, 12% of men report income <20 thousand reais/month and 40% income >50 thousand reais/month (p=0.011).
Region of residence covariable
When evaluating the region of residence, it was observed that between 34.7% and 50% use medical marketing advice. Of these, the most proportional are from the Midwest and South, with 50% of respondents from each region. Concerning the absolute value, most are found in the Southeast, where 22 (34.7%) of the respondents reported using advice (p=0.023).
Regarding the number of children, between 13 and 40% do not have children, with the highest percentage referring to the Midwest. Between 13 and 37.5% have 1 child, the largest representative being the South region. Between 20 and 56.5% have 2 children, with greater representation in the Northeast. Between 3.1 and 28.6% have 3 or more children, with the North being the largest representative (p=0.036).
Regarding reported ethnicity, 100% of respondents from the Midwest are white, vs. 96.9% from the South, 89.2% from the Southeast, 73.9% from the Northeast, and 57.1% from the North. At the same time, 42.9% of respondents from the North refer to mixed race, in addition to 26.1% from the Northeast and 5.4% from the Southeast. We obtained 2 respondents from the Southeast who self-reported as black (p=0.038).
Children covariable
When comparing the presence of children with mental exhaustion during the SARS-CoV-2 pandemic, we observed very important Exhaustion of 34.1% and 34.7% for the absence of children and with 2 children, respectively. Those without children present 36.4% and 34.1% of medium or very intense exhaustion. Those with 1 child have 31.4 and 28.6% little or medium exhaustion. Those with 2 children have 34.7% and 23.6% very or little exhaustion. Those with 3 or more children had 57.2% of medium-intensity burnout (p=0.026).
Marital status is proportional to the number of children. 38.6% of those without children are married, vs. 74.3%, 80.6%, and 85.7% with 1 child, 2 children, and 3 or more children, respectively. About 25% of those without children reported a stable relationship, compared to 0% of those with 3 or more children (p<0.001).
The association between time since graduation and the number of children reveals that 43.2% of those without children graduated <5 years ago, against 8.6% of those with 1 child and 2.8% of those with 2 children. Those with >20 years of graduation comprise the majority of the groups, with 43.2% of those without children and 57.2% of those with 3 or more children (p=0.001).
Finally, significance was obtained when comparing the covariate with average monthly income. Up to 34.1% of those without children receive less than 20 thousand reais/month and 29.5% receive more than 50 thousand reais/month. At the same time, 40.3% of those with 2 children receive more than 50 thousand reais/month and 11.1% less than 20 thousand reais/month. None of those with 3 or more children reported an income of less than 20,000 reais/month and 42.9% reported an income above 50,000 reais/month (p=0.006).
Practice time covariable
Correlations were found between length of practice, use and importance of marketing advice, number of children, average income, and decrease in surgical volume during the Sars-Cov-2 pandemic. Similar to the previous topic, the children variable is directly proportional to the length of service, with up to 60% of those between 11 and 20 years of service having 2 children (p<0.001).
When assessing the use of advice, 57.7% of those under 5 years old; 40.9% of those under 10 years old and 47.5% of those under 20 years old use marketing consultancy, vs. 81.8% of those aged over 20 who do not use it (p=0.001). At the same time, 88.4% of those with less than 5 years of training refer equal or greater importance to marketing, vs. 83.2% of those with more than 20 years of training, who refer less than or equal to the average importance to marketing (p=0.004).
Decreased surgical volume had a similar impact between tracks. Up to 47.5% of those with 6 to 10 years of training and 45.5% of those with 11 and 20 years of training reported a very important impact. Impacts of medium or lesser intensity were evaluated in 69.2% of those with more than 20 years of training and those with less than 5 years (p=0.028).
In our sample, up to 50% of those with less than 5 years of experience receive more than 50 thousand reais/month and 30.8% less than 20 thousand reais/month. In comparison, 33.8% of those aged 6 to 11 receive 50 thousand reais/month and 20.8% between 31 and 40 thousand reais/month, and 30% of those aged 11 to 20 years receive between 31 and 40 thousand reais/month. month. There is a trend of income growth up to 20 years of experience, with a tendency to decline thereafter (p=0.076).
COVID-19 infection covariable
Infection with the Covid-19 virus was related to changes in the relationship with work and decreased surgical volume during the pandemic. We observed that 47.4% and 35.8% of those who did not contract the disease found a change in their relationship with high- and medium-impact work vs. 44.3% and 27.1% of those who did. However, a complete change was reported only in those who reported infection, totaling 7.1% of these (p=0.018).
Similarly, we observed greater intensity associated with a decrease in surgical volume. Between 41.4% and 21.4% of those who contracted COVID showed a great and complete intensity reduction, vs. 53.7% and 6.3% of those who did not contract it (p=0.006).
Working hours covariable
Working time was directly associated only with the importance given to marketing. Around 33.3% of those with > 60 hours a week mentioned the importance of greater intensity, against 20% of those with < 30 hours a week. At the same time, 25% of those with < 30 hours reported very little intensity vs. 13.3% of those with > 60 hours (p=0.047).
Income covariable
Monthly income was the variable with the most significant relationships in our study. It relates to sex, children, working hours, marketing advice, and the Sars-Cov-2 pandemic.
The number of children significantly correlates with income. Among respondents with monthly income of less than 20,000 reais, 53.6% reported not having children and 28.6% reported having 2 children. Among those with monthly income above 50,000 reais, 22.8% reported not having children, 50.9% reported having 2 children and 10.5% reported having 3 children (p=0.006).
About 53.6% of those reporting income of less than 20,000 reais per month are male and 46.4% are female. Of those with monthly income above 50,000 reais, 12.3% were female and 82.7% were male (p=0.011).
The weekly workload significantly correlates with income but with p=0.075 in this sample. Those with lower income report working hours < 30 hours in 21.4% of cases, from 31 to 40 hours in 35.7%, and > 60 hours in 10.7%. Those with higher income report shifts of < 30 hours in 10.5% of cases, from 51 to 60 hours in 29.8%, and > 60 hours in 26.3%.
Of those with income < 20,000 reais a month, 89.3% do not use marketing advisory services; on the other hand, for those with income >50,000 reais a month, 50.9% refer to the use of marketing advisory services (p=0.004). In the first group, 32.1% refer to the need to look for new forms of income during the Sars-Cov-2 pandemic with the greatest intensity, while in the second, 47.4% refer to the lowest intensity of need for additional income during the pandemic (p<0.001).
Regarding the Sars-Cov-2 pandemic, 39.3% of those with income <20,000 reais/month directly cared for patients with Covid-19, while 10.5% of those with monthly income >50,000 reais participated (p=0.015). Among the income groups, those with < 20,000 reais per month reported alterations in responses in the WHOQOL-Bref questionnaire with an intensity greater than or equal to the average in 82.1% of cases, against 56.2% of those with income > 50,000 reais per month (p=0.015).
More intense mental exhaustion was reported by 10.7% of those with the lowest income, while 1.8% of those with the highest income reported the same intensity. However, when considering the intensity equal to or greater than the average, the percentages range from 78.5% to 55.6%. Those with monthly income above 40 thousand reais reported the lowest intensity at 21.4% (p=0.047).
Changes in interpersonal relationships follow a similar path to mental exhaustion, where 14.3% of those with lower income report changes of greater intensity, against 5.3% of those with higher income. Even so, when observing changes with an impact greater than or equal to the average, we obtain 92.9% of respondents in the first group against 73.7% in the last one (p=0.016).
Relationships with work were also affected: 67.9% of those with an income < 20,000 reais/month reported changes of great impact, against 42.1% of those with income > 50,000 reais/month. Maximum impact changes were reported in the income group < 20 thousand reais/month (7.1%), from 20 to 30 thousand reais/month (3.2%), and from 30 to 40 thousand reais/month (5.7 %). Minimal impact changes were reported in those with income > 50 thousand reais/month in 8.8% of respondents (p=0.056).
The relationship with work is proportional to the surgical volume. Those with lower income reported a more intense reduction in 35.7% of respondents, against 3.5% of those with higher income. There were also 8.8% of those with income > 50,000 reais/month who reported a decrease in minimal impact surgeries. When evaluating changes with an impact greater than or equal to the average, we obtained 92.8% of those with the lowest income and 71.9% of those with the highest income (p=0.007).
Increased substance use was observed similarly between groups. Around 28.6% of those with the lowest income reported an increase; 38.7% of those who receive between 20 and 30 thousand reais/month and 22.8% of those who receive > 50 thousand reais/month (p=0.051).
DISCUSSION
The present study aims to compare socio-demographic characteristics and the WHOQOL-Bref questionnaire’s response profile to characterize the Brazilian plastic surgeons’ population and identify ways to improve quality of life. The choice of the research model has in mind the scientific validation of the questionnaire for acquiring objective data concerning the quality of life and the possibility of carrying out future studies and comparing longitudinal data.
Until the time of publication, the current study received information from 168 plastic surgeons, most of whom declared themselves to be: men (75.59%), over 50 years old (45%), white (87.9%), married (68.5%), with at least 2 children (43.6%) and living in the Southeast region (56.4%). Initially, the statistical analysis established that 365 subjects were needed to obtain enough data for a 95% confidence interval. Therefore, we must not forget that the analyzes proposed here will reflect, so far, on specific data for the studied population.
When evaluating the training time, monthly income, and the number of children, we see a certain proportionality between the data; that is, the surgeon tends to earn more with the time of work and then have more children. This association can be related both to the higher workload of the young surgeon and work stress and to family planning, without, in the present study, the possibility of affirming a cause-and-effect relationship, something that should be studied in the future.
When considering the impact of specialists’ working hours during the COVID-19 pandemic, this study evaluated 3 main aspects: The weekly workload, the weekly number of surgeries, and the plastic surgeon’s individual perception of how much the current health situation has impacted the operative activity.
The descriptive interpretation of the data indicates that the majority profile (>50%) of the survey participants are specialists who work 31 to 60 hours a week (69.7%), perform up to 5 surgeries a week (77.6%), and who assigned importance of grade 4 or more (61.2%), according to the Likert scale, to the negative impact of the pandemic on individual surgical production.
Previous studies that descriptively relate such variables are scarce in the literature. Sarac et al.12 point out that the plastic surgeons who participated in the survey reported a drastic reduction in the performance of procedures, with the sub-specialties aesthetics (outpatient and surgical) and gender reassignment being the most affected. Also, in a cross-sectional survey, Joji et al.13 pointed out that the entire sample, made up of plastic surgeons who specialized in cosmetics, reported a significant financial impact due to the reduction in professional activity.
Furthermore, from an inferential point of view, the impact on the workday of plastic surgeons was statistically and significantly related only to the covariate of the use of marketing assistance. We found that the longer the weekly working hours, the greater the importance given to medical marketing advisory services (p=0.047). Our study also identified that men give more importance to marketing (p=0.034), corroborating Sorice at al.14, this shows that the advisory platform most used by plastic surgeons is predominantly male.
Still, concerning medical marketing, the present study found greater use of advisory services among the young population of physicians with experience < 20 years. These results are similar to the study by Araújo et al.15, in which, despite demonstrating that the largest portion of the population of doctors from Paraná does not carry out any form of disclosure and that when they do, it is through websites and magazines, participants with a time of experience < 5 years were those most associated with expenses for publicity and medical marketing advisory services.
On the other hand, the work by Schmidt et al.16 carried out among doctors from different specialties within the five major areas (gynecology and obstetrics, general surgery, pediatrics, internal medicine and family and community medicine) found only that a minority of 14.9% of the participants had already consulted the Medical Affairs Disclosure Commission (CODAME), however, failing to mention other forms of medical marketing consultancy. Accordingly, 62.9% of physicians in the study by Schmidt et al.16 reported having already faced difficulties due to a lack of knowledge about medical advertising, with 94.5% of the total sample referring to the need to update on the subject.
Also, in this study, it is noticed that 60% of the participants reported never having had contact with medical advertising during graduation, similar to the results of the study Alves et al.17 on medical marketing knowledge among medical students. In it, 83.2% of the participating academics mentioned that they had not had access to this theme at any time in college.
When considering our results, with greater importance given to medical marketing reported by young surgeons (less than 20 years of experience), we can assume a relationship both with the immersion of young generations with communication technologies and with the lack of addressing issues related to medical advertising and individual action on university issues (according to studies by Schmidt et al.16 and Alves et al.17). Such facts, combined with the desire to enter the labor market, would possibly lead to a greater need for external assistance through marketing advisory services.
As for the results related to mental exhaustion, we found greater intensity of exhaustion in plastic surgeons. This result is consistent with the study by Vallée et al.18, “Prospective and observational study of COVID-19’s impact on mental health and training of young surgeons in France”, which collected demographic and mental health-related data from 1001 participants (residents and fellows in surgical specialties) in 18 regions of France between April 10 and May 7, 2020. This study identified that women were at higher risk of developing anxiety, depression and insomnia. Such data also corroborate studies such as that by Civantos et al.19, which had the participation of 163 physicians (25.7% women), who observed that female surgeons showed greater screening for burnout when compared to the study’s surgeons.
Regarding monthly income, we have that: 34.5% of participants earn more than 50 thousand reais, 21.2% between 31 and 40 thousand reais, 18.8% between 20 and 30 thousand reais and 17% less than 20 thousand real. It is possible to compare with the income distribution of Brazilian physicians in general, divided as follows: 54.5% receive less than 20 thousand reais per month (18.5% receive 10 thousand reais or less) and 11.4% receive from 32 thousand reais per month20.
Our study identified that among plastic surgeons throughout Brazil there is a proportional relationship between training time and salary (p=0.076), which is similar to the study carried out by Arruda et al.21, in which plastic surgeons from the state of Goiás (p<0.001).
A relationship between salary and sex was also identified, in which males had a higher income than females (p=0.011). This relationship can be explained by the demography of plastic surgeons, with a lower overall proportion of women, who also have a lower average time of practice.
CONCLUSION
The present study aimed to identify sociodemographic factors associated with the quality of life of Brazilian plastic surgeons. However, we have not yet obtained a sufficient number of respondents to translate it into the reality of the country as a whole. However, the methodology allows the progress of the research and temporal reassessment with relative ease, with the development of longitudinal analyzes in the future.
In this way, we show descriptive data that allow us to infer factors related to the professional’s health in the physical and biopsychosocial scope of the population of respondents. These obtained positive scores above 50% in all domains of the WHOQOL-bref questionnaire, a value that can be used and compared to other studies that use the same methodology, standardized by the World Health Organization.
We observed that the monthly income variable had the highest number of significant relationships, relating to the male gender, the highest number of children, the highest number of working hours and the use of marketing advisors.
With this information, we can make an overview of the specialty, which allows self-assessment and self-care. By comparing one’s own responses to those of peers, the WHOQOL-bref questionnaire could be used to assess the individual and encourage the taking of preventive measures for his or her mental health.
Similarly, institutions that train plastic surgeons will be able to use research to monitor the development of their professionals during and after specialization. Identifying moments that support and reception measures can be taken to promote the health of professionals, in addition to stimulating long-term programs.
Future works will be able to take advantage of this database to evaluate the quality of life in a longitudinal way. By comparing quality of life with the historical moment and measures taken by the SBCP, it would be possible to answer questions of cause and effect, in order to improve the general quality of life of the plastic surgeon. We also believe that the current analysis is important to initiate these studies and draw attention to the quality of life of trained professionals and those undergoing training.
1. Hospital das Clínicas, Faculdade de Medicina, Universidade de São Paulo, São Paulo,
SP, Brazil
2. Sociedade Brasileira de Cirurgia Plástica, Associação Brasileira de Ligas de Cirurgia
Plástica, São Paulo, SP, Brazil
Corresponding author: Guilherme Frederico Ferro Alves Av. Dr. Enéas Carvalho de Aguiar, 255, Departamento de Cirurgia Plástica, Cerqueira César, São Paulo, SP, Brazil. Zip code: 05403-000 E-mail: guilhermeffalves@hotmail.com
 Read in Portuguese
 Read in English
 PDF PT
 Print
Print
 Send this article by email
 How to Cite
 Mendeley
 Pocket